
Charted: Where North America gets its electricity
According to the independent energy think tank EMBER, approximately 30% of the world’s electricity came from renewable sources — hydropower, wind, solar, geothermal, wave, tidal, and biomass and waste — in 2023. As the world races to decarbonize and bring on cleaner sources of electricity, it got us wondering how North America’s electricity grid stacks up against the rest of the world. Using data from EMBER and the Energy Institute via Our World in Data we explore North America’s electricity mix in 2023 and how it has changed over the years. Let’s dive in!
North America’s electricity comes mainly from fossil fuels
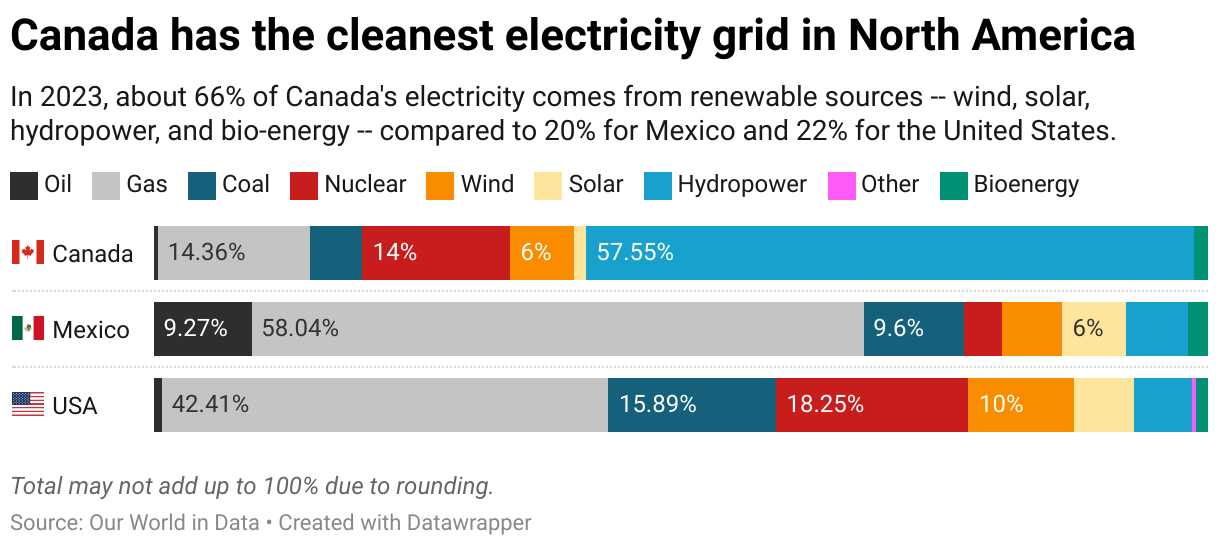
In 2023, Canada, Mexico, and the United States collectively produced 5,432.09 terawatt-hours (TWh) of electricity with more than half (55%) coming from oil, coal and natural gas, and just over 28% from renewable sources.
The electricity mix looks different at the country level. Of the three North American countries Canada has the greenest electrical grid. Approximately 66% of its electricity is from renewable sources and about 80% comes from low-carbon sources (renewables and nuclear). Its primary source of electricity is hydropower.
Canada’s southern neighbours depend more on fossil fuels to meet their electricity needs. Natural gas was the main source of electricity in the US and Mexico, making up 42% and 58% of total electricity generation in each country respectively. Both countries rely heavily on carbon-intensive sources to produce electricity with renewables making up a small but growing proportion of total electricity output. In 2023, renewables accounted for about one-fifth of Mexico’s electricity production compared to about 77% from fossil fuels. In the United States, about 22% of its electricity comes from renewables versus 59% from fossil fuels. Check out the chart below for a breakdown of electricity sources for each country.
Evolution of North America’s electricity mix
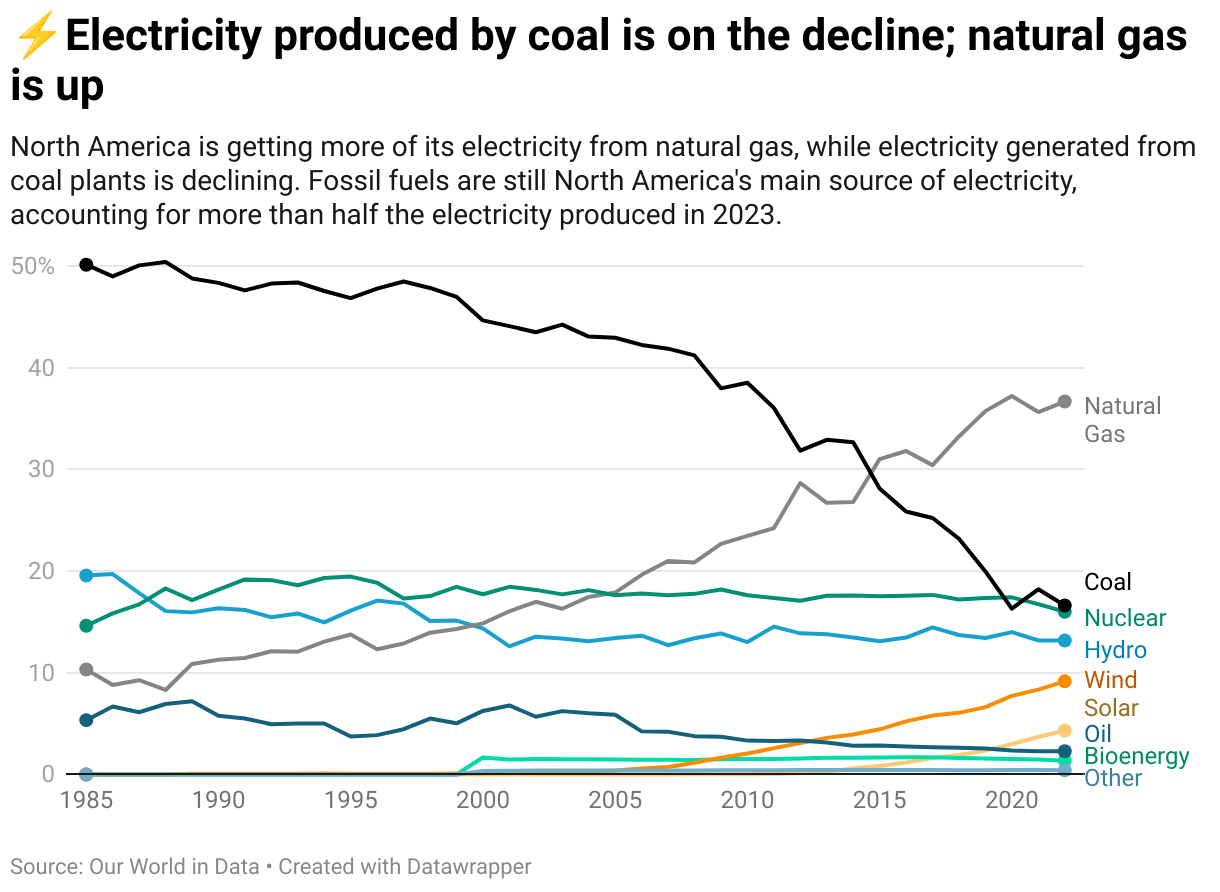
In the mid-1980s, more than 50% of the electricity in North America came from coal. Over the years, Canada, Mexico, and the United States have shifted toward less carbon-intensive sources of electricity while phasing out coal power plants. This has resulted in coal’s share of the electricity mix shrinking considerably. In 1985, coal’s share of the electricity mix was 50.13% and in 2023 its share dropped to 16.3%, a reduction of 32 percentage points during that period. Despite the decline, coal still produced the second-most electricity in 2023.
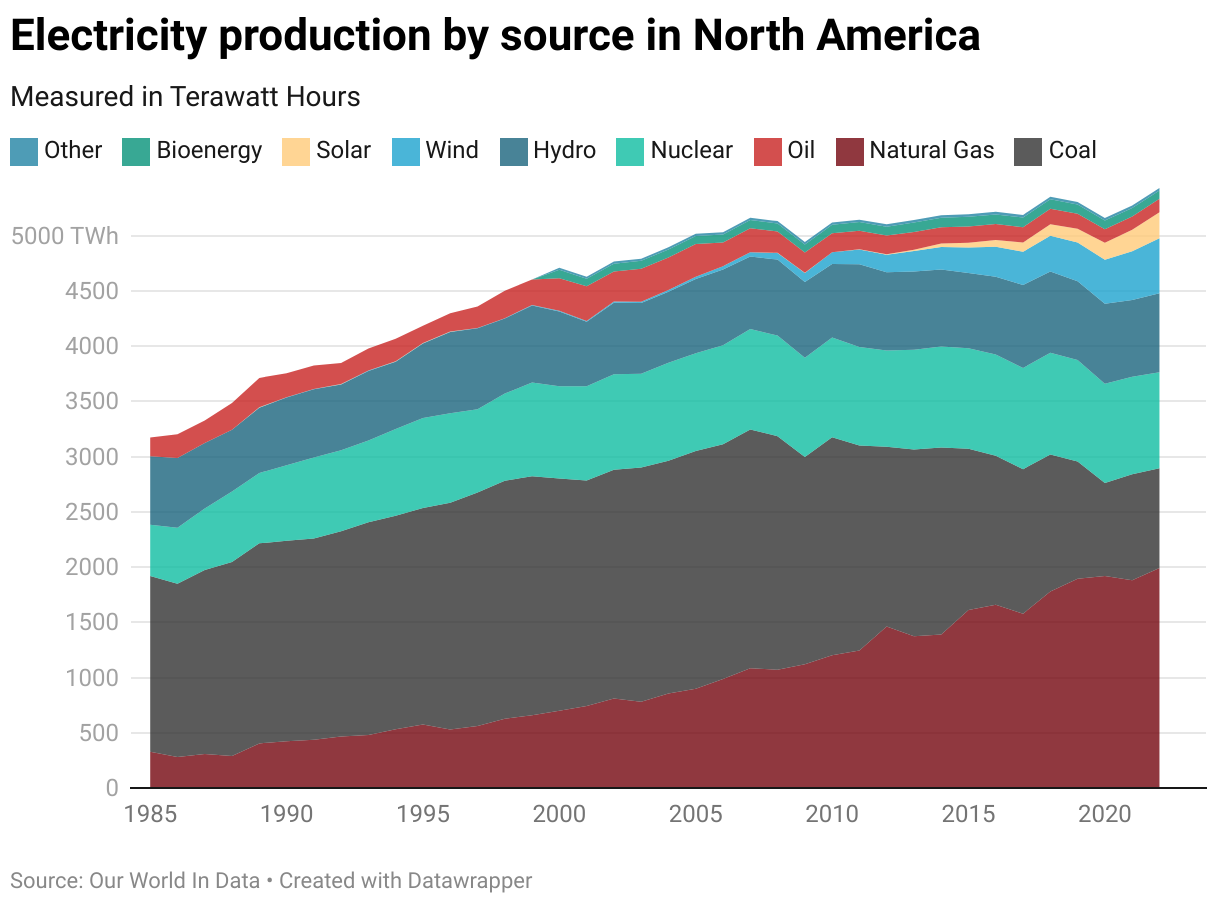
In 2015, natural gas replaced coal as the top electricity source in North America, a position it has held on to ever since. In 2022, 1,992 TWh, or 36.7% of the electricity came from natural gas. The top five sources of electricity in North America that year were natural gas, coal, nuclear, hydropower and wind.
Investments in solar and wind power plants are helping bring cleaner sources of electricity online across the continent. As of 2022, wind, solar, and bioenergy made up almost 11% of the electricity mix, up about 6 percentage points from its share in 2012.
The two charts below show annual changes in electricity mix as a share of total electricity output, and changes in the total annual electricity production output by each source between the years 1985 and 2022.
The North American electricity mix will continue to evolve as new solar and wind projects come online. We’re eager to see what these charts will look like in decade.
You may also like


Finland is the happiest country in the world, according to the latest World Happiness Report. It’s the eighth consecutive year the Nordic country has topped the list. Following Finland are fellow Nordic countries Denmark, Iceland, and Sweden. The Netherlands rounds out the top five.