
Charted: NATO defense spending by country

April 4, 2024, marked the 75th anniversary of the establishment of the North Atlantic Treaty Organization (NATO). Founded following the end of World War II, the goal of NATO is to secure lasting peace in Europe and North America. Lately, we’ve been reading a lot about NATO and the 2% of GDP guideline. We wanted to dig into this some more. In this story, we use data from the CIA World Factbook and NATO, to break down the national defense expenditures for each NATO member nation based on current prices and exchange rates.
Founding of NATO and enlargement
On April 4, 1949, Foreign Ministers from twelve nations — Belgium, Canada, Denmark, France, Iceland, Luxembourg, the Netherlands, Norway, Portugal, the United Kingdom and the United States — gathered in Washington, DC, USA, to sign the Washington Treaty, bringing NATO to life. Throughout its 75-year history, NATO has gone through several rounds of enlargement expanding to include almost three times the number of nations as when it was first created.
NATO first expanded its membership in 1952 with the addition of Greece and Turkey. The alliance grew modestly throughout the Cold War with West Germany joining in 1955 and Spain in 1982. The late 1990s saw the alliance gain three new members — Czechia, Hungary, and Poland.
The largest expansion of NATO came in 2004 when seven countries — Bulgaria, Estonia, Latvia, Lithuania, Romania, Slovakia, and Slovenia — joined the alliance.
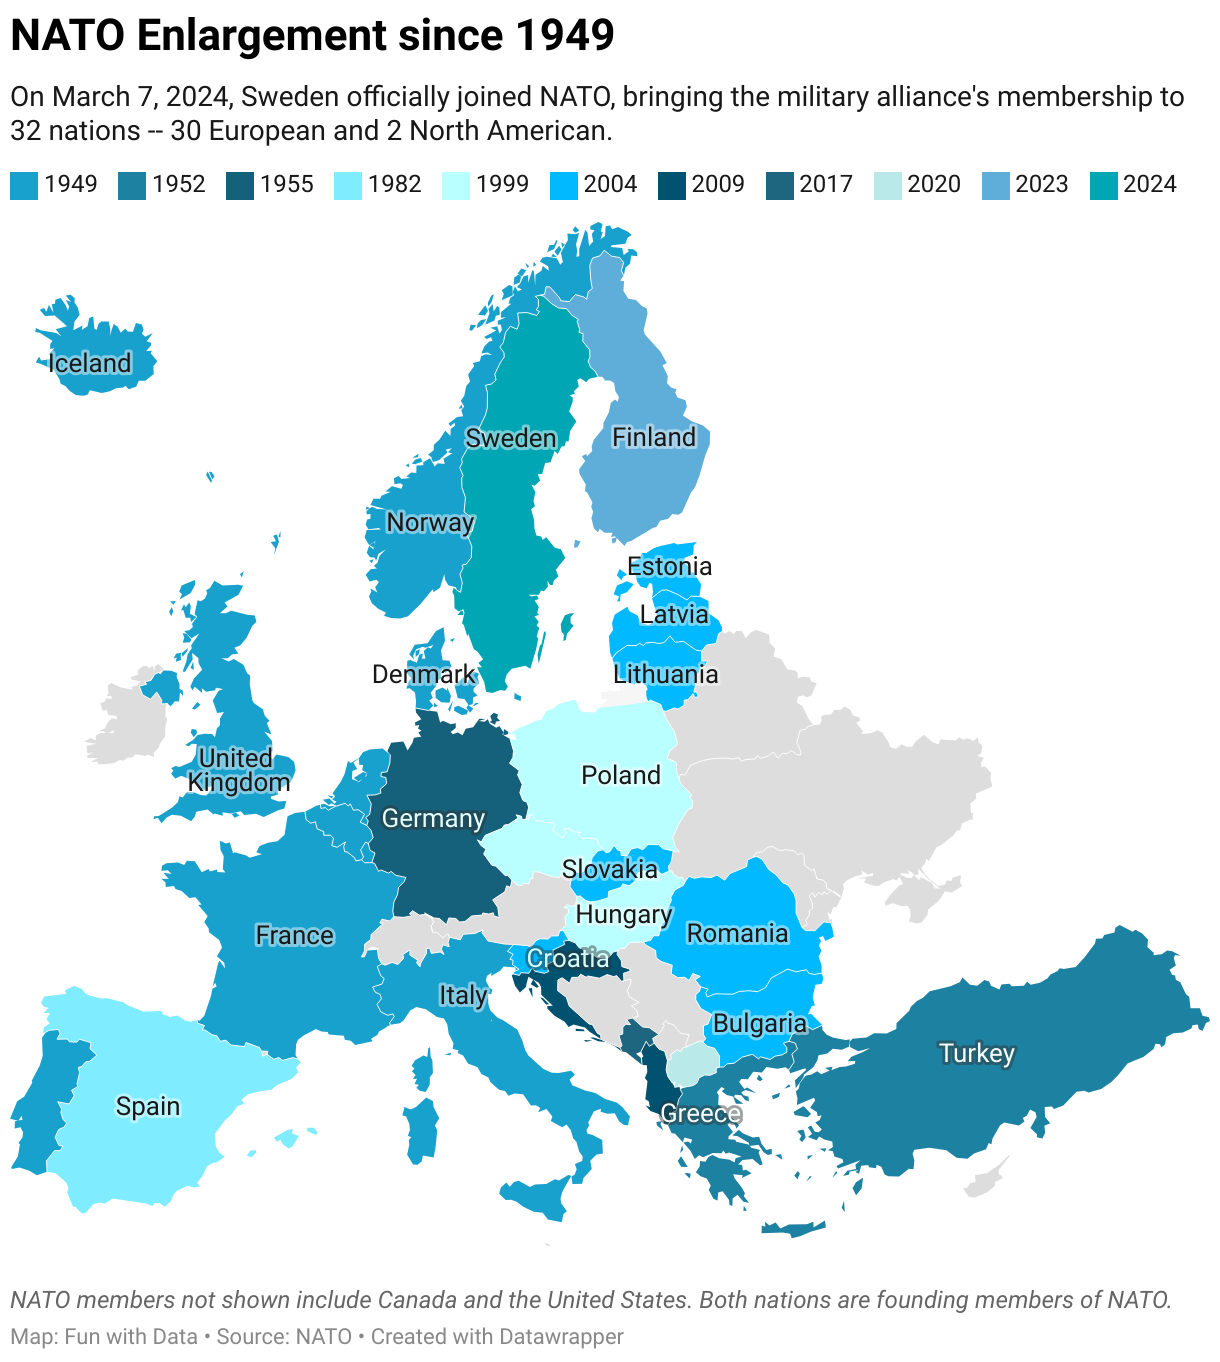
On March 7, 2024, Sweden became the latest nation to join the military alliance bringing NATO’s membership to 32 nations — 30 European nations, Canada and the United States. The map below shows all of the current members of NATO located in Europe. Not shown are Canada and the United States.
Defense spending as a percentage of GDP
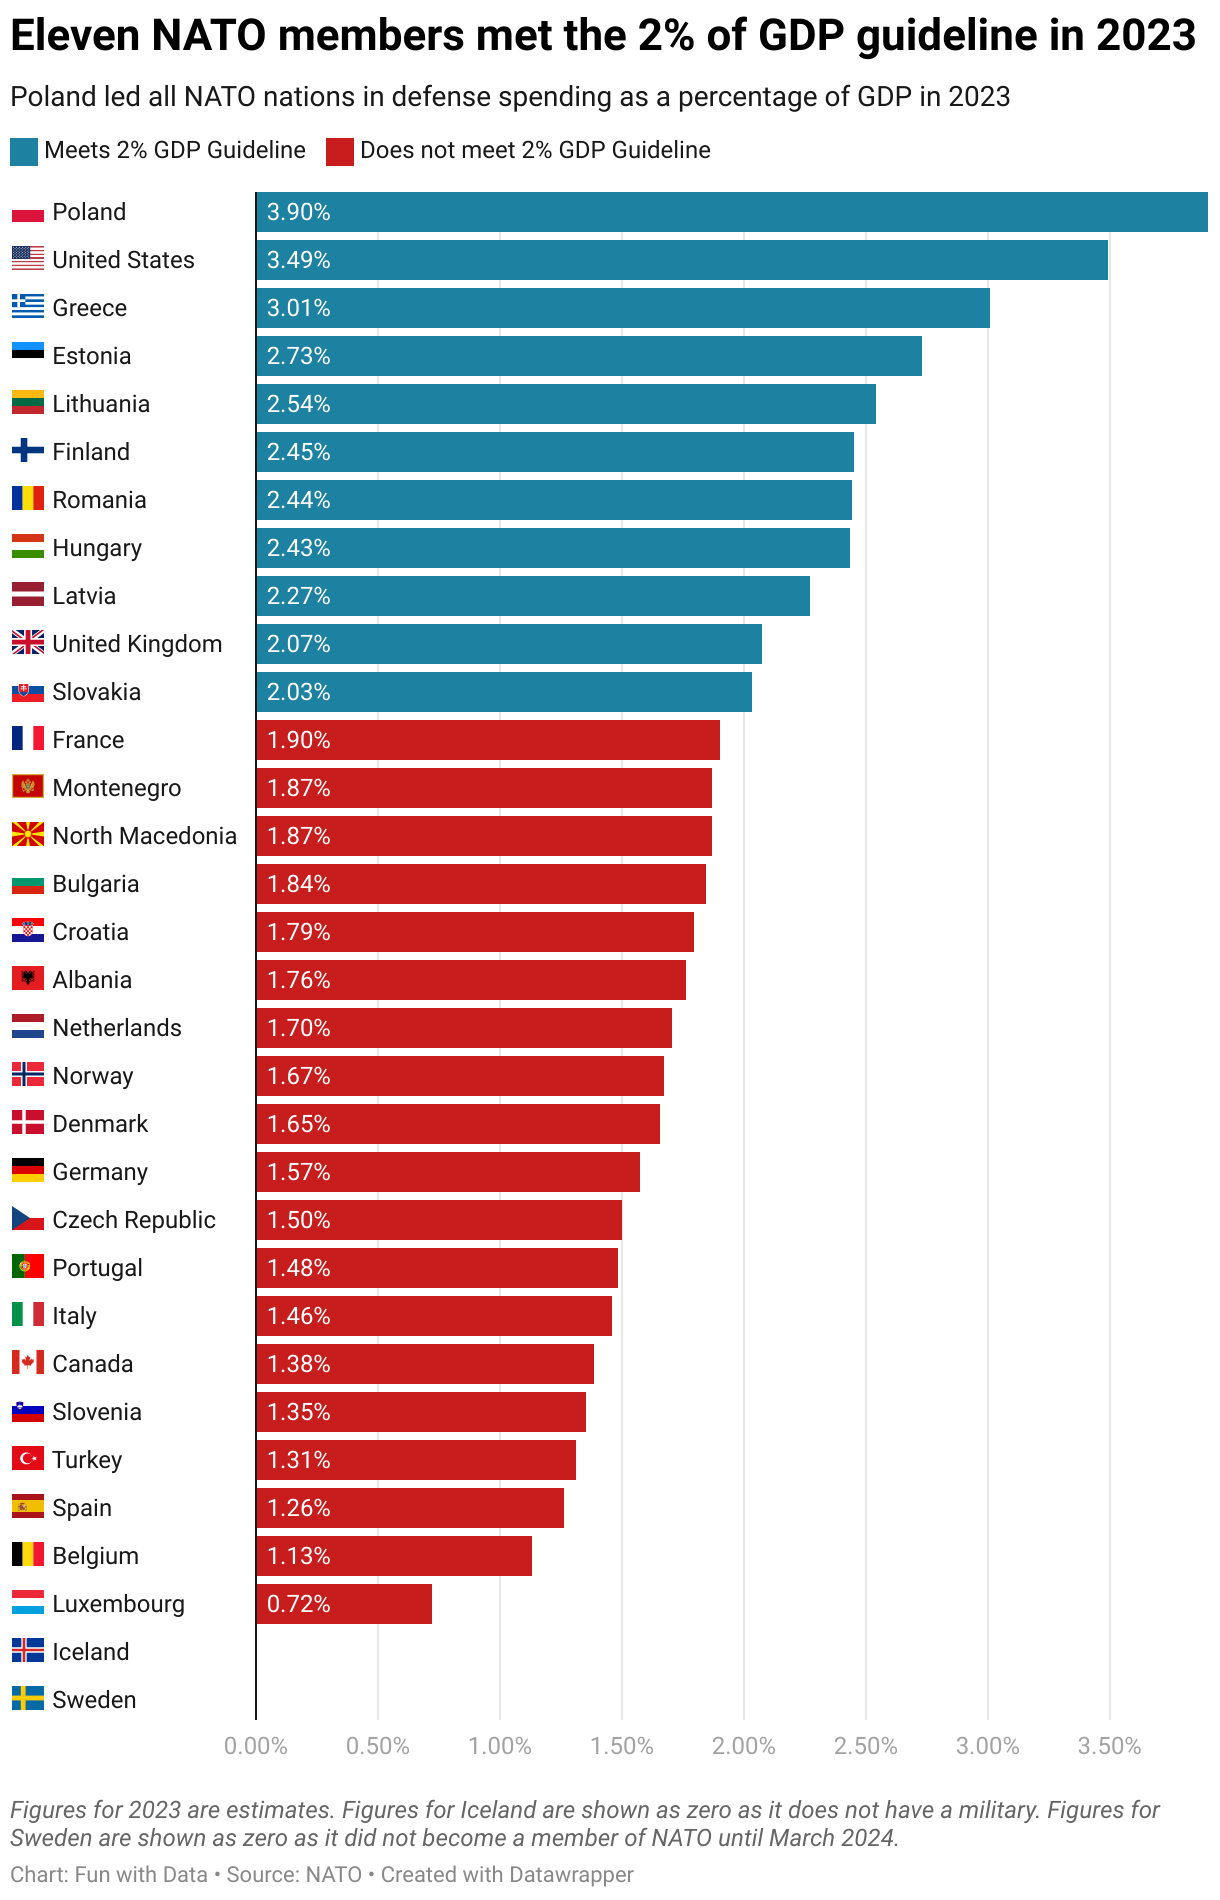
At the Wales Summit in 2014, NATO Allies promised to boost defense investments. The goal is to invest 2% of GDP annually on defense by 2024, with 20% of that on major equipment. In 2023, 11 NATO members met the 2% target. Four of which — Poland, Latvia, Lithuania, and Romania — have national laws or political agreements that require 2% of GDP to be spent on national defense. NATO estimates that two-thirds of members will reach the 2% of GDP guideline in 2024 compared to just three Allies in 2014.
Poland was the biggest spender as of share of GDP in 2023. It spent 3.9% of its GDP on defense, more than the United States (3.49%) in second, and Greece (3.01%) the next closest. The chart below shows the each NATO members defense spending as a share of their GDP in 2023.
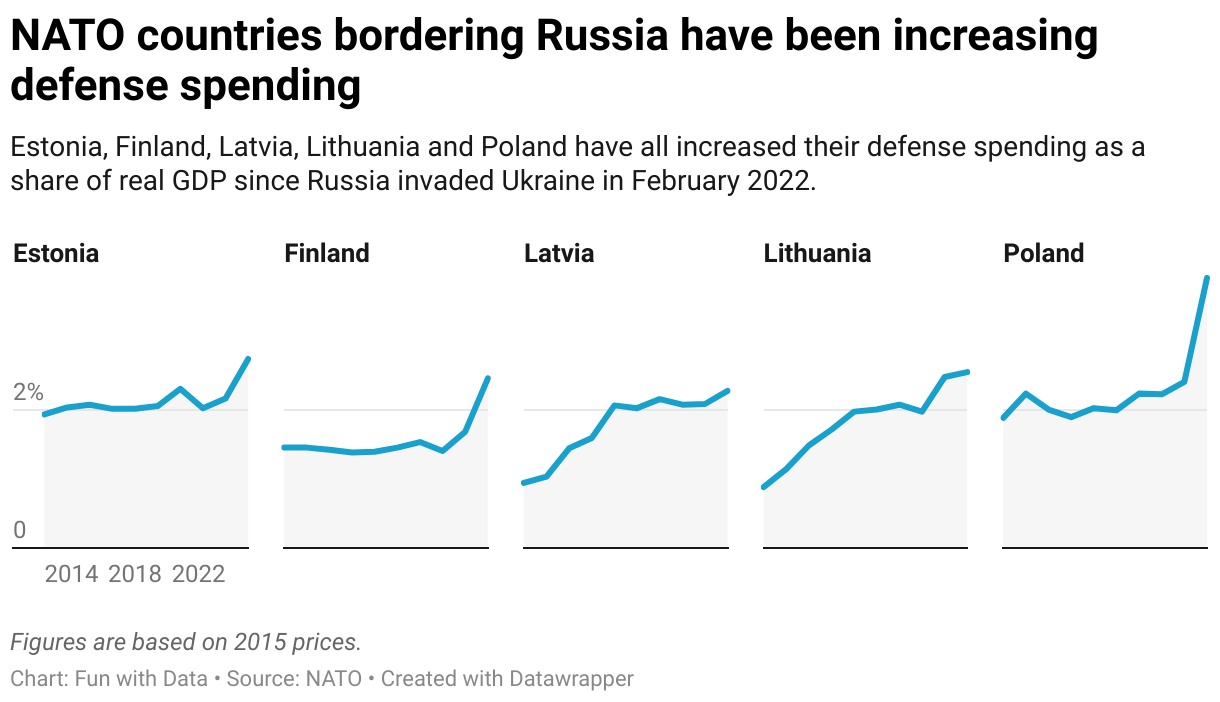
One notable trend is that all NATO countries that share a border with Russia — Poland, Estonia, Latvia, Lithuania, and Finland — have been spending more on defense following Russia’s invasion of Ukraine in February 2022. Poland increased its defense spending by 63.76% compared to 2022. While Estonia, Latvia, Lithuania, and Finland saw their military spending increase by 24.71%, 10.10%, 3.08%, and 45.73%, respectively compared to 2022.
Defense spending in raw numbers
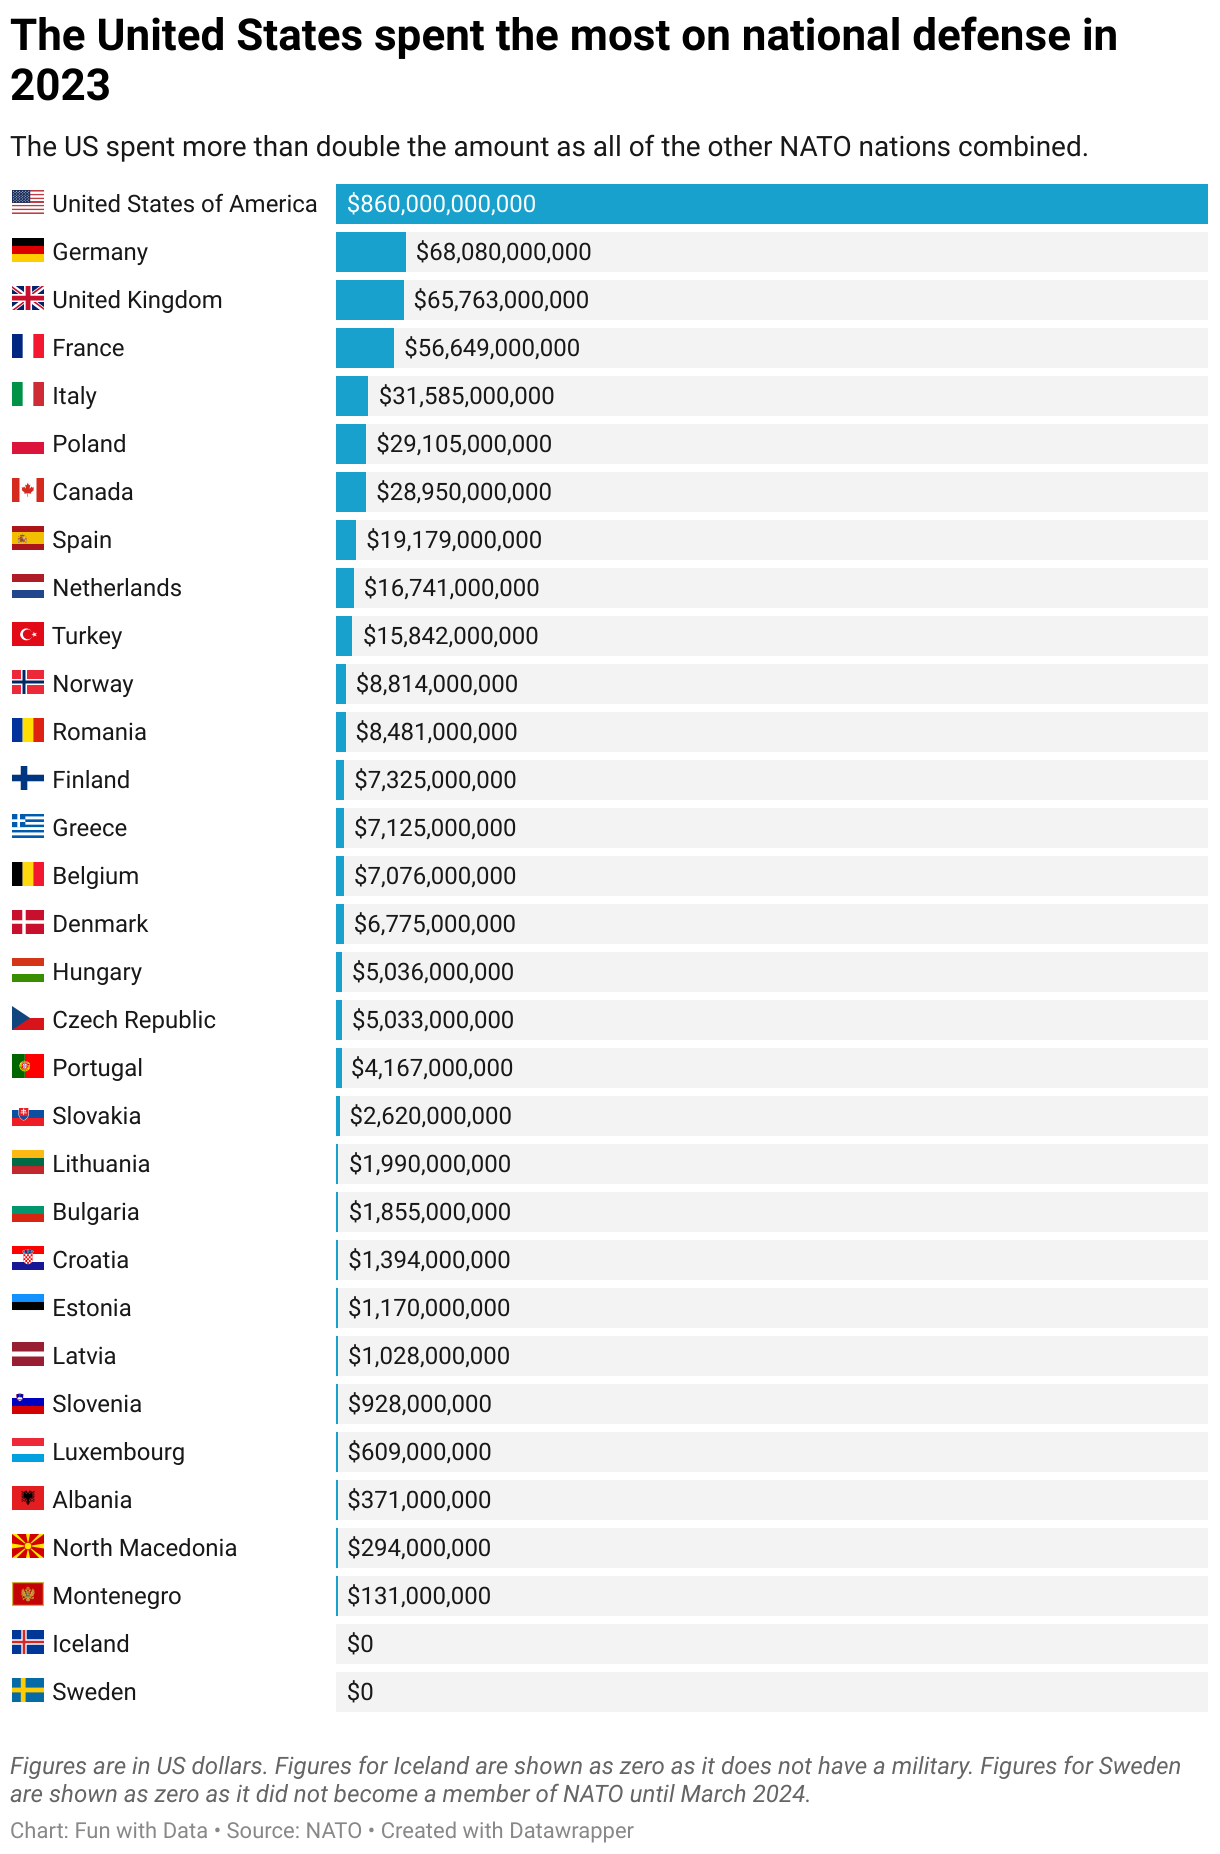
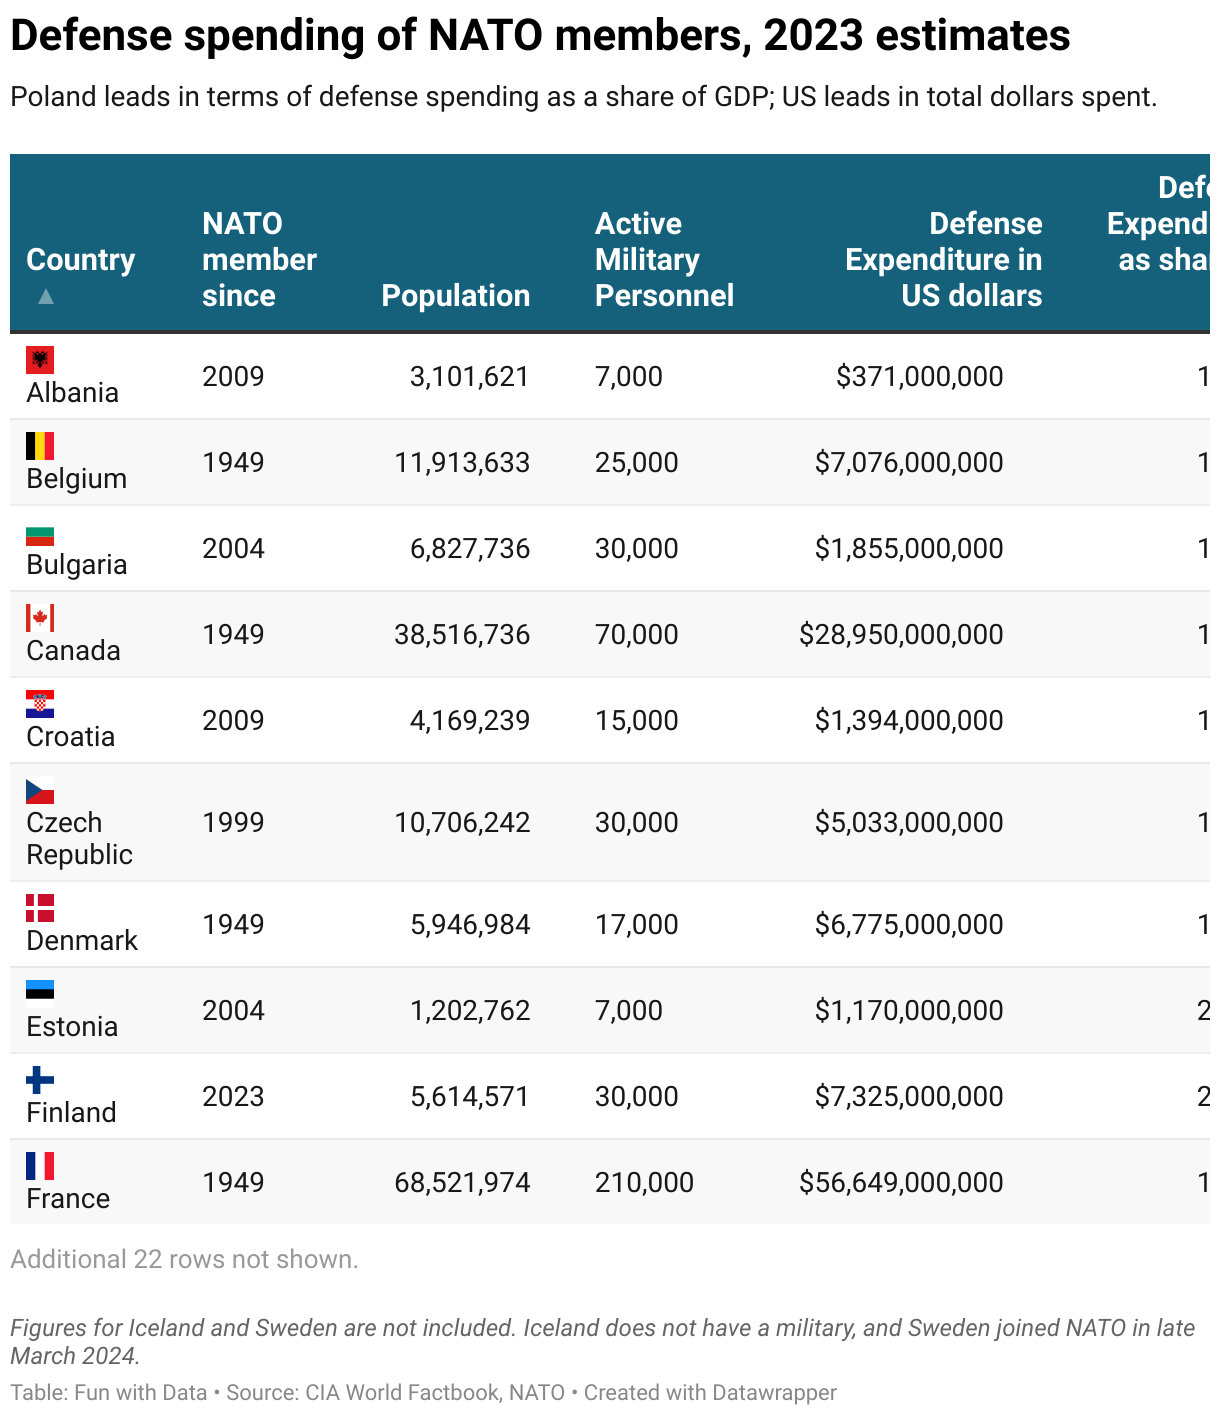
Let’s take a different look at defense spending. While Poland may spend the most as a share of GDP, the United States is the leader in total dollars spent on defense. Collectively, NATO members spent $1.2 trillion with the United States leading the way with an estimated $860 billion — more than double the amount all other NATO allies in Europe and Canada spent combined and about 68% of total defense expenditures by NATO countries in 2023. Germany came in second place at $68 billion, less than one-tenth (8%) of the US spent. Here is a breakdown of the defense spending per NATO country in US dollars for 2023.
If you prefer looking at data in tables, check out the summary table below showing key stats from 2023.
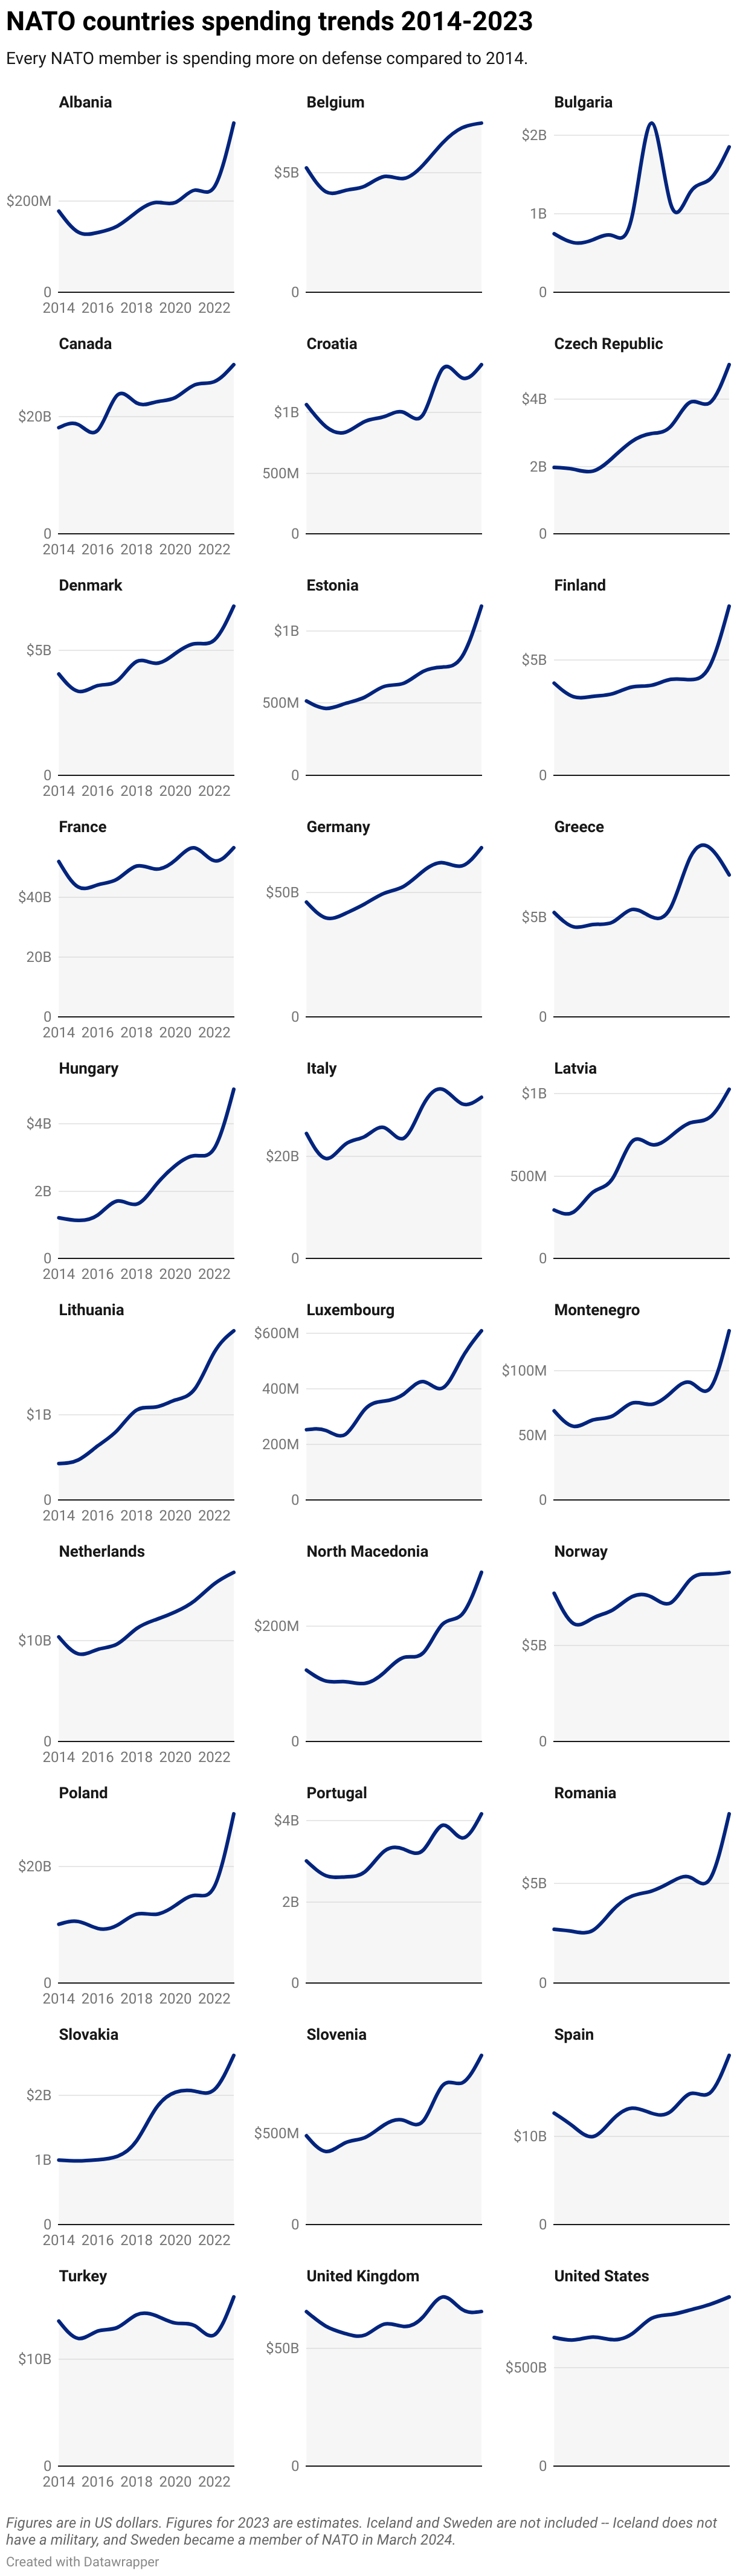
NATO members are spending more on national defense
Since 2014, there has been an upward trend in national defense spending across all NATO member nations. This reflects the commitment of all members to collective security. The charts below show national defense spending figures for each NATO member. All figures are in US dollars.
You may also like


We use Microsoft Excel regularly to clean and organize datasets and to perform analysis. To help speed up the process, we’ve started putting together a list of keyboard shortcuts that we typically use and have shared them here.